Response analysis
The Response Analysis section on an item's detail page shows how test-takers answered it. Once responses exist, you can see the total response count, how answers were distributed across choices, and — for objective items — the percentage who answered correctly.
View response analysis
- Open the item in Quiz Designer.
- Navigate to the Response Analysis section on the item detail page.
- Select Response Analysis to expand the section.
Data loads automatically when you open the section.
Read the results
The display varies depending on the item type.
Choice-based items
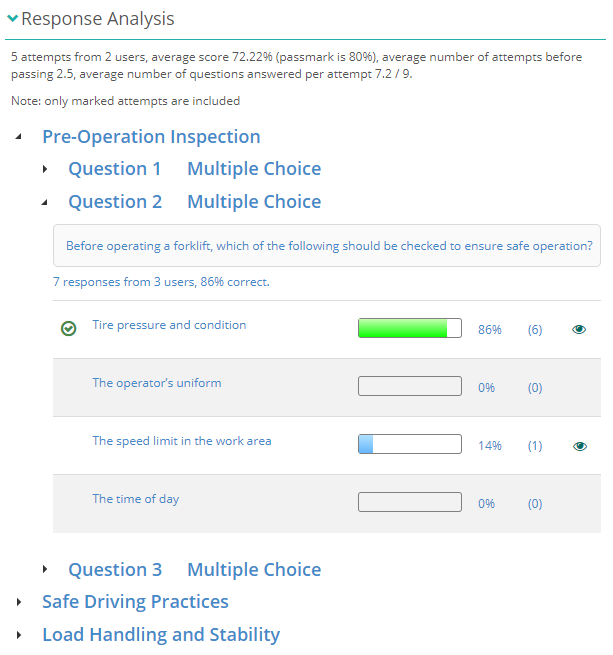
For multiple choice, true/false, hotspot, and similar items, the section shows:
- A summary line with the total number of responses, the number of unique users, and — for non-survey items — the percentage who answered correctly.
- A table listing each answer choice with a percentage bar and count. A tick icon marks the correct answer.
- An eye icon next to any choice that has responses — select it to review a test-taker's attempt.
Short answer items
For short answer items, the section shows:
- A summary line with total responses, unique users, average response length in words, and the number of distinct responses.
- A sample of up to five responses. Select Load more to view additional responses in batches of five.
Match items
For matching items, responses are grouped by prompt. Each group shows a percentage bar table using the same format as choice-based items.
File upload items
For file upload items, the section shows file submission statistics.
Composite items
For composite items with multiple interactions, the section shows a breakdown per interaction.
Settings
There are no user-configurable settings for this feature. Visibility of the Response Analysis section is controlled by your Janison administrator via the GetQuestionAnswerStatistics permission.